

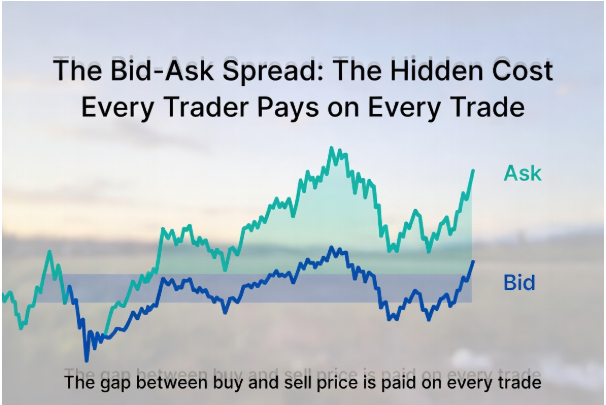
Every trade you have ever made started at a loss. Not because the position moved against you, but because of the bid-ask spread explained in a single sentence: the price you pay to buy is always higher than the price you receive if you sell at the same instant. That gap is the spread, and it exists in every market, on every instrument, at every moment the market is open. What changes between forex, crypto, and stocks is not whether the spread exists, but how wide it runs, how it is quoted, and what conditions make it expand or contract.
The Mechanics: Why Two Prices Exist
Markets do not clear at a single price. They clear at two prices simultaneously, because buyers and sellers have different motivations and different valuations of the same asset at the same moment.
The bid is the highest price any buyer in the market is currently willing to pay. The ask is the lowest price any seller is currently willing to accept. Between them sits the spread: the gap that neither side is willing to cross without an incentive. When you place a market buy order, you accept the ask, the seller’s price. When you place a market sell, you accept the bid, the buyer’s price. The spread is the difference, and it is deducted from your position the moment you enter.
If EUR/USD shows 1.08502 bid and 1.08510 ask, the spread is 0.8 pips. Buy one standard lot and you can immediately sell back at 1.08502, so you are 0.8 pips underwater before the exchange rate moves at all. For that trade to reach break-even, the ask price must rise to 1.08510 while your sell price rises to meet your entry cost. The market has to move in your favour by the full spread width just to get you to zero.
This is why the spread matters more than most traders initially appreciate. It is not a fee that appears on a statement. It is a cost embedded in the price structure itself, invisible unless you know to look for it.
Why Liquidity Is the Only Variable That Really Matters
Strip away the labels across all three asset classes and one factor determines the spread in every case: how many buyers and sellers are present, and how large their orders are. Liquidity is the spread made visible.
When a market has deep liquidity, the gap between what buyers will pay and what sellers will accept narrows to almost nothing, because competition among participants on each side pushes the prices together. When liquidity is thin, the gap widens, because the remaining participants have no competition forcing them to sharpen their quotes. Market makers, the firms that provide continuous bid and ask prices, also widen their quotes when they carry more inventory risk, which is why spreads expand during volatile conditions in every market simultaneously.
The three asset classes sit at different points on this liquidity spectrum, for structural reasons specific to each.
Forex: Why It Sets the Benchmark
Forex is the most liquid market in the world by daily turnover, which is why it produces the tightest bid-ask spreads of any asset class. EUR/USD and USD/JPY trade through a single deep global interbank network that connects banks, institutions, and electronic platforms across every timezone. The depth of that pool keeps bid-ask gaps tight around the clock on weekdays, narrowing further during the London-New York overlap when participation is at its peak.
The spread hierarchy inside forex tracks liquidity directly. EUR/USD is the most traded currency pair in the world and carries the tightest spreads: fractions of a pip during peak hours on competitive platforms. GBP/USD and USD/JPY are close behind. Step into minor pairs like EUR/CAD and spreads widen modestly. Move to exotic pairs like USD/TRY or USD/ZAR and spreads can run tens of pips, because the interbank market for these pairs is thin and market makers charge accordingly for the inventory risk of holding positions in them.
Stocks: It Depends Entirely on the Company
Stock spreads follow the same liquidity logic but applied at the individual company level rather than the market level. A blue-chip stock trading millions of shares daily can have a spread of one cent or less because the order book is continuously replenished by institutional and retail flow from both sides. A thinly traded small-cap stock with intermittent volume might show a spread of 1% or more because few orders sit at the best bid and ask, and market makers charge more to compensate for the risk of being caught holding inventory in an illiquid name.
Stock spreads are quoted in cents per share, which makes percentage comparison the only sensible way to evaluate them against other asset classes. A $0.05 spread on a $200 stock is 0.025%, tighter than most forex pairs. The same $0.05 spread on a $2 stock is 2.5%, which makes the instrument borderline unviable for active trading without a substantial directional move to recover it.
Stocks also have defined exchange hours, which creates a specific spread widening pattern. During pre-market and after-hours trading, participation drops sharply and spreads widen substantially. During the first and last 15 minutes of the regular session, volume spikes but order flow is imbalanced, which also produces wider spreads than mid-session. Stress events compress this pattern: during the March 2020 equity sell-off, spreads on major indices and large-cap stocks widened far beyond their normal ranges as liquidity providers pulled back.
Crypto: Fragmented and Volatile
Crypto produces the widest and most variable spreads of the three asset classes, for reasons rooted in how the market is structured rather than in any inherent property of the assets themselves.
| Market | Typical spread on liquid instrument | Spread quoted in | Trading hours |
| Forex (major pair) | 0.1 to 1 pip | Pips | 24/5 |
| Stocks (large-cap) | 0.01% to 0.1% | Cents per share | Exchange hours |
| Crypto (Bitcoin) | 0.02% to 0.1% | Price or % | 24/7 |
| Crypto (altcoin) | 0.5% to 5%+ | % | 24/7 |
The fragmentation problem is central. Forex clears through one deep global interbank pool. Stocks clear through regulated exchanges that consolidate prices across venues. Crypto clears across hundreds of separate exchanges, each with its own order book and its own spread. The same Bitcoin can show a different bid-ask gap on different platforms at the same moment, which is why cross-exchange arbitrage exists as a distinct trading activity. The spread you see on any one platform reflects only the liquidity of that platform’s order book.
Volatility compounds this. Bitcoin can move 5% in a single session under normal conditions; EUR/USD rarely moves that much in a month. When prices move fast, market makers everywhere widen their quotes to reduce their risk of being caught on the wrong side of a large move. In crypto, where both the fragmentation and the volatility are pronounced, this widening is sharper and more frequent than in either forex or stocks.
How the Spread Changes Your Trading Calculus
The same spread figure has different practical weight depending on how you trade and what you are trying to achieve.
For a long-term investor holding a position for months or years, paying the spread once is a rounding error against the expected return. A 0.05% spread on a position targeting a 40% move over two years barely registers in the final P&L. The spread matters, but it is not a material constraint on the strategy.
For an active day trader making 20 round trips a week, the same 0.05% spread accumulates to 2% per week just in spread costs, before any other fees. At that frequency, the spread is not a rounding error: it is a significant drag that must be cleared by the strategy’s edge before any net profit is possible. This is why active traders gravitate relentlessly toward the most liquid instruments during their most liquid hours, and why instrument selection for a scalper is inseparable from spread analysis.
The comparison across markets is most useful when converted to a consistent percentage basis. A 1-pip spread on EUR/USD at 1.0850 is 0.009%. A $50 spread on Bitcoin at $100,000 is 0.05%. A $0.02 spread on Apple at $200 is 0.01%. Expressed this way, the relative cost of trading in each market becomes directly comparable rather than obscured by the different units each market uses to quote prices.
Conclusion
The bid-ask spread is the most universal cost in trading. It exists because markets need intermediaries willing to take the other side of trades at any moment, and those intermediaries charge for that service through the gap between buy and sell prices. Forex tightens it through scale and depth. Stocks tighten it for large companies and widen it for small ones. Crypto widens it through fragmentation and volatility. In all three cases, the mechanism is identical and the driver is the same: the more liquid the market, the tighter the spread. Every trader who understands this stops treating the spread as background noise and starts treating it as the first number to check before placing any trade.